This group project is the final project for CIS 450/550 (Scalable and Cloud Computing). It was selected by the professor as one of the three projects that stood out among the array of projects submitted that semester.
Other group members: Josh Cohen, Yonah Mann, and Palmer Paul.
Throughout the project, we all collaborated while maintaining responsibility over our own chunk of the project. I was primarily responsible for cleaning the data, setting up the database, and uploading the data. It was important for us that we communicate often and clearly to ensure that the best decisions were made regarding the schema, architecture, and how the pieces fit together.
Data Sources
One of the challenging aspects of this project revolved around the size of the available datasets. This introduced complications both in the data upload and in the queries and their optimizations. When uploading the data, we were faced with the tradeoff of uploading using our personal computers, where disk space was plentiful (> 250 GB) but network bandwidth was limited (3 Mb/s), or uploading using our university's computing environment, which had higher bandwidth (64 Mb/s) but limited disk space (16 GB).
GitHub Archive
Our first data source for GitHub data was GH Archive. This site keeps track of 20+ event types (such as PushEvent, CreateEvent, etc.) that occur on public repos, along with associated repo and user information. The site aggregates the data into hourly chunks, which are stored as JSON files. The dataset is massive, with over 20000 files totalling about 16 GB compressed and 100 GB uncompressed, so we chose to restrict our scope to 3 months of data (Jan-Mar 2019). Since each file was relatively small, we were able to utalize the university's computing environment to speed up the process of uploading the data to the SQL server.
GitHub API
The GitHub data that we got from GH Archive was missing some information that is crucial to our analysis; namely programming language usage information for a given repo. In order to get this information, we needed to make calls to the GitHub API, which provided us with the languages used and number of bytes of each language. This was complicated by the fact that the API has a 5,000 request/hour limit, which forced us to only ingest a fraction of the available data over a long period of time.
StackOverflow
StackOverflow publishes a dump of their data on Archive.org every 3 months or so. Much like the GitHub data, this dataset is large, at about 14 GB compressed and 85 GB uncompressed. This time, however, the data was split across only three files. This data was retrurned in XML format and had all the information we needed (posts, tags, users).
Questions
Given the data that we found, we came up with a set of questions we thought were interesting and can be reasonably answered using the data. The questions got us thinking about the schema and queries we'd use to answer them. The questions we had in mind were:
- Which languages are most common in GitHub?
- Which repos use language X the most?
- How popular was language X in StackOverflow posts the past few weeks?
- How closely related are two programming languages X and Y in the developer community?
- For a given week, what are the most popular languages on GitHub and StackOverflow?
We can answer this question easily if we have a mapping from repos to the languages they use and number of bytes.
To answer this question, we'd want to associates repos with the languages they use and the amount (in bytes).
We can answer this question easily since the StackOverflow dataset has the attributes we need (content, tag, and timestamp).
This question can be interpretted in different ways. We chose to tackle this from two perspectives. The first being how often two languages are in a StackOverflow post (e.g. a post is tagged with both python and html). The second being how often two languages are used in the same GitHub repo. To answer both subquestions, we'd want to associate 1) StackOverflow posts with their tags 2) GitHub repos with the languages they use and the amount. We also need to perform entity resolution, since a language shows up differently in the GitHub data vs. the Stackoverflow data.
Since the GitHub data has repo events with the timestamp, we can look at this question from many perspectives (e.g. number of commits, number of created repos, etc.). We chose to focus on number of repos created since it has the clearest connection to popularity. On the other hand, commits can be misleading since the frequency varies a lot depending on the specific repo and work being done and the developer's inclination to commit and push often.
Using StackOverflow data, we can look at when posts were created and the number of comments as an indicator of popularity.
Project Architecture
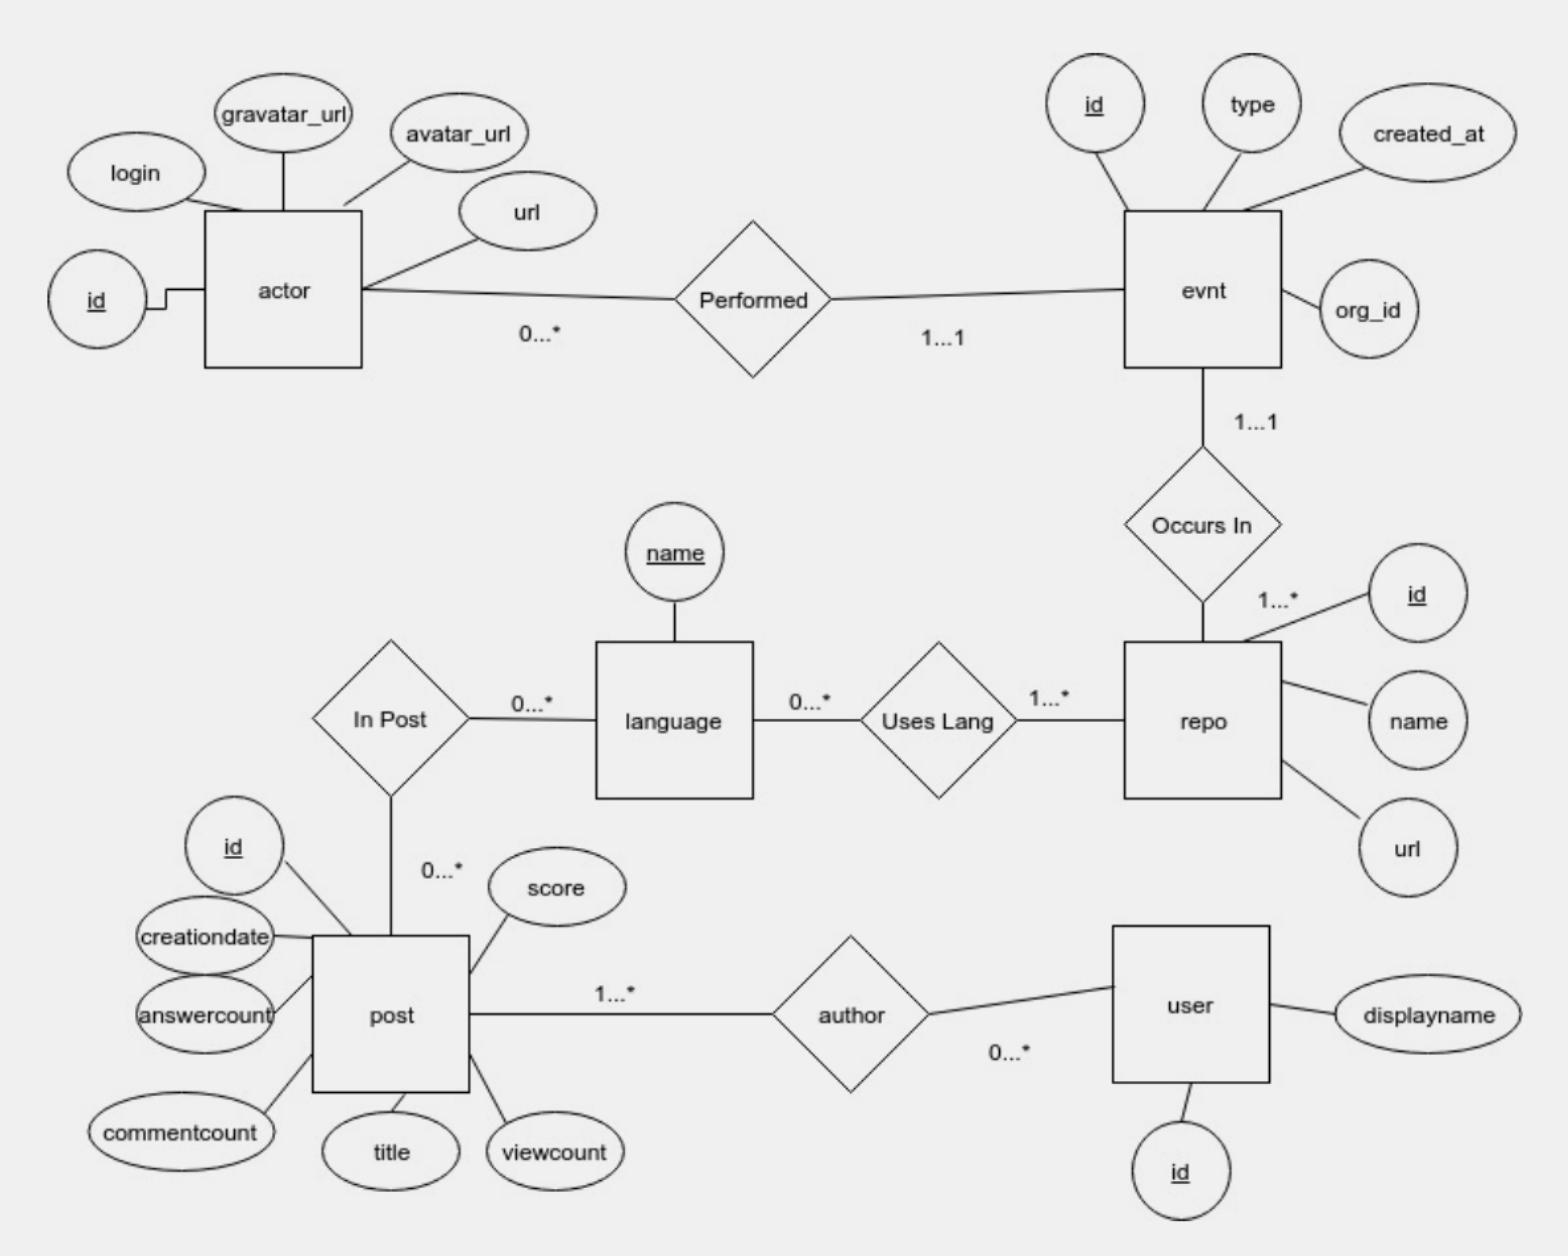
Database Schema and Entity Resolution
Most of the schema was based on the structure of the input data. The exception was for the table containing github repos and languages used, since we had to fetch the data ourselves.
- GitHub Schema:
- actor(id, login, gravatar_id, avatar_url, url)
- evnt(id, type, created_at, repo_id, actor_id, org_id)
- languages(name, language, bytes)
- repo(id, name, url)
- StackOverflow Schema:
- post(id, author, creationdate, score, viewcount, title, answercount, commentcount)
- posttags(id, tagname)
- users(id, displayname)
- tags(name, count)
Since languages are represented as different strings on the two sites (JavaScript vs. javascript), we had to figure out a way to resolve entities in both datasets. We ended up forcing all strings to lowercase since the only difference was in capitalization.
Data Cleaning and Ingest
Before thinking about how we wanted to clean and ingest the data, We wrote python scripts to download, unzip, parse, clean, and prepare the data for ingestion. Since GH Archive didn't have the repo language composition data that we needed, we wrote a script that retrieves the data using GitHub's API. Since there was a 5,000 request per hour limit, we scheduled the script to run hourly usign CRON. The raw data contained many attributes that weren't relevant to the analysis, so we only kept what we needed. The data also wasn't directly mapped to our schema, so we parsed the data and prepared csv files that match our schema to optimize the ingestion process.
Database
We used PostgreSQL hosted on AWS RDS as our database. We wanted an RDBMS that provided support for many advanced SQL constructs and optimizations, that were useful for some of our complex queries. Since our tables were extremely large (millions of rows), it was important that we optimize our queries well to ensure low latency. On top of the primary key indexes, we added B+ tree indexes for some of the attributes. Since the data is in disaggregate form and most of the queries perform similar aggregations, we added views for the aggregates.
Our optimizations ended up significantly improving performance. One query went from 55.6s to 5.7s after adding the index, and down to 9.2ms after adding the aggregate view. Adding the indexes also improved two other queries, going from 14.7s to 88ms and from 27.3s to 119ms. On the other hand, adding the view also improved a query's execution time from 34s to 10ms.
Web App
We used python's flask library for the backend, which we hosted on AWS Elastic Beanstalk. The API endpoints receive a request from the client, queries our database, and responds to the client. For the front-end, we used Elm, a purely functional language that compiles to Javascript. We also used Bootstrap to style the pages.