Preview
Background
I started working on this project to explore the various ways of approximating the value of \(\pi\). What I enjoyed the most about working on this project is how nicely D3.js can be integrated with React to design visually stimulating and interactive graphs.
Methods
Several methods of estimating \(\pi\) were used in this project. The following list explains each method and how it works.
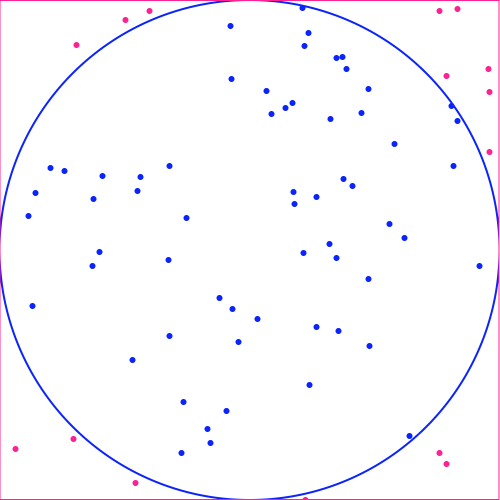
Area of a circle inscribed in a square
This method of approximating \(\pi\) revolves around the idea that the ratio of the area of a circle to the area of the square it is inscribed within is equal to an expression in terms of \(\pi\). By approximating the ratio, we can derive an approximation of \(\pi\). We can approximate the area using the Monte Carlo method, which is basically the process of randomly picking points from the area of the square. The proportion of points within the circle is an unbiased estimate of the ratio of the areas.
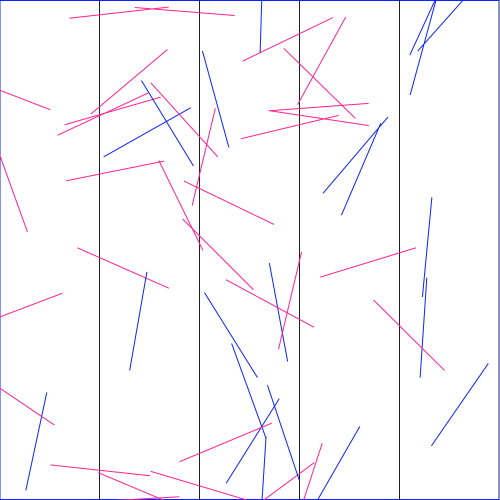
Buffon's Needle
The Buffon's Needle problem asks for the probability of a needle of length \(l\) landing on a line, given that the floor contains parallel lines equally-spaced with distance \(d\). The general form of this problem does not place any restrictions on \(l\) and \(d\). If we consider the simple form of the problem, when \(l = d\), the probability is equal to \(2 \ \ / \ \ \pi\). By randomly "dropping" needles and calculating the proportion of needles crossing a line, we can approximate the probability and thus derive an estimate for \(\pi\).